
Documentation/Analytics
Analytics
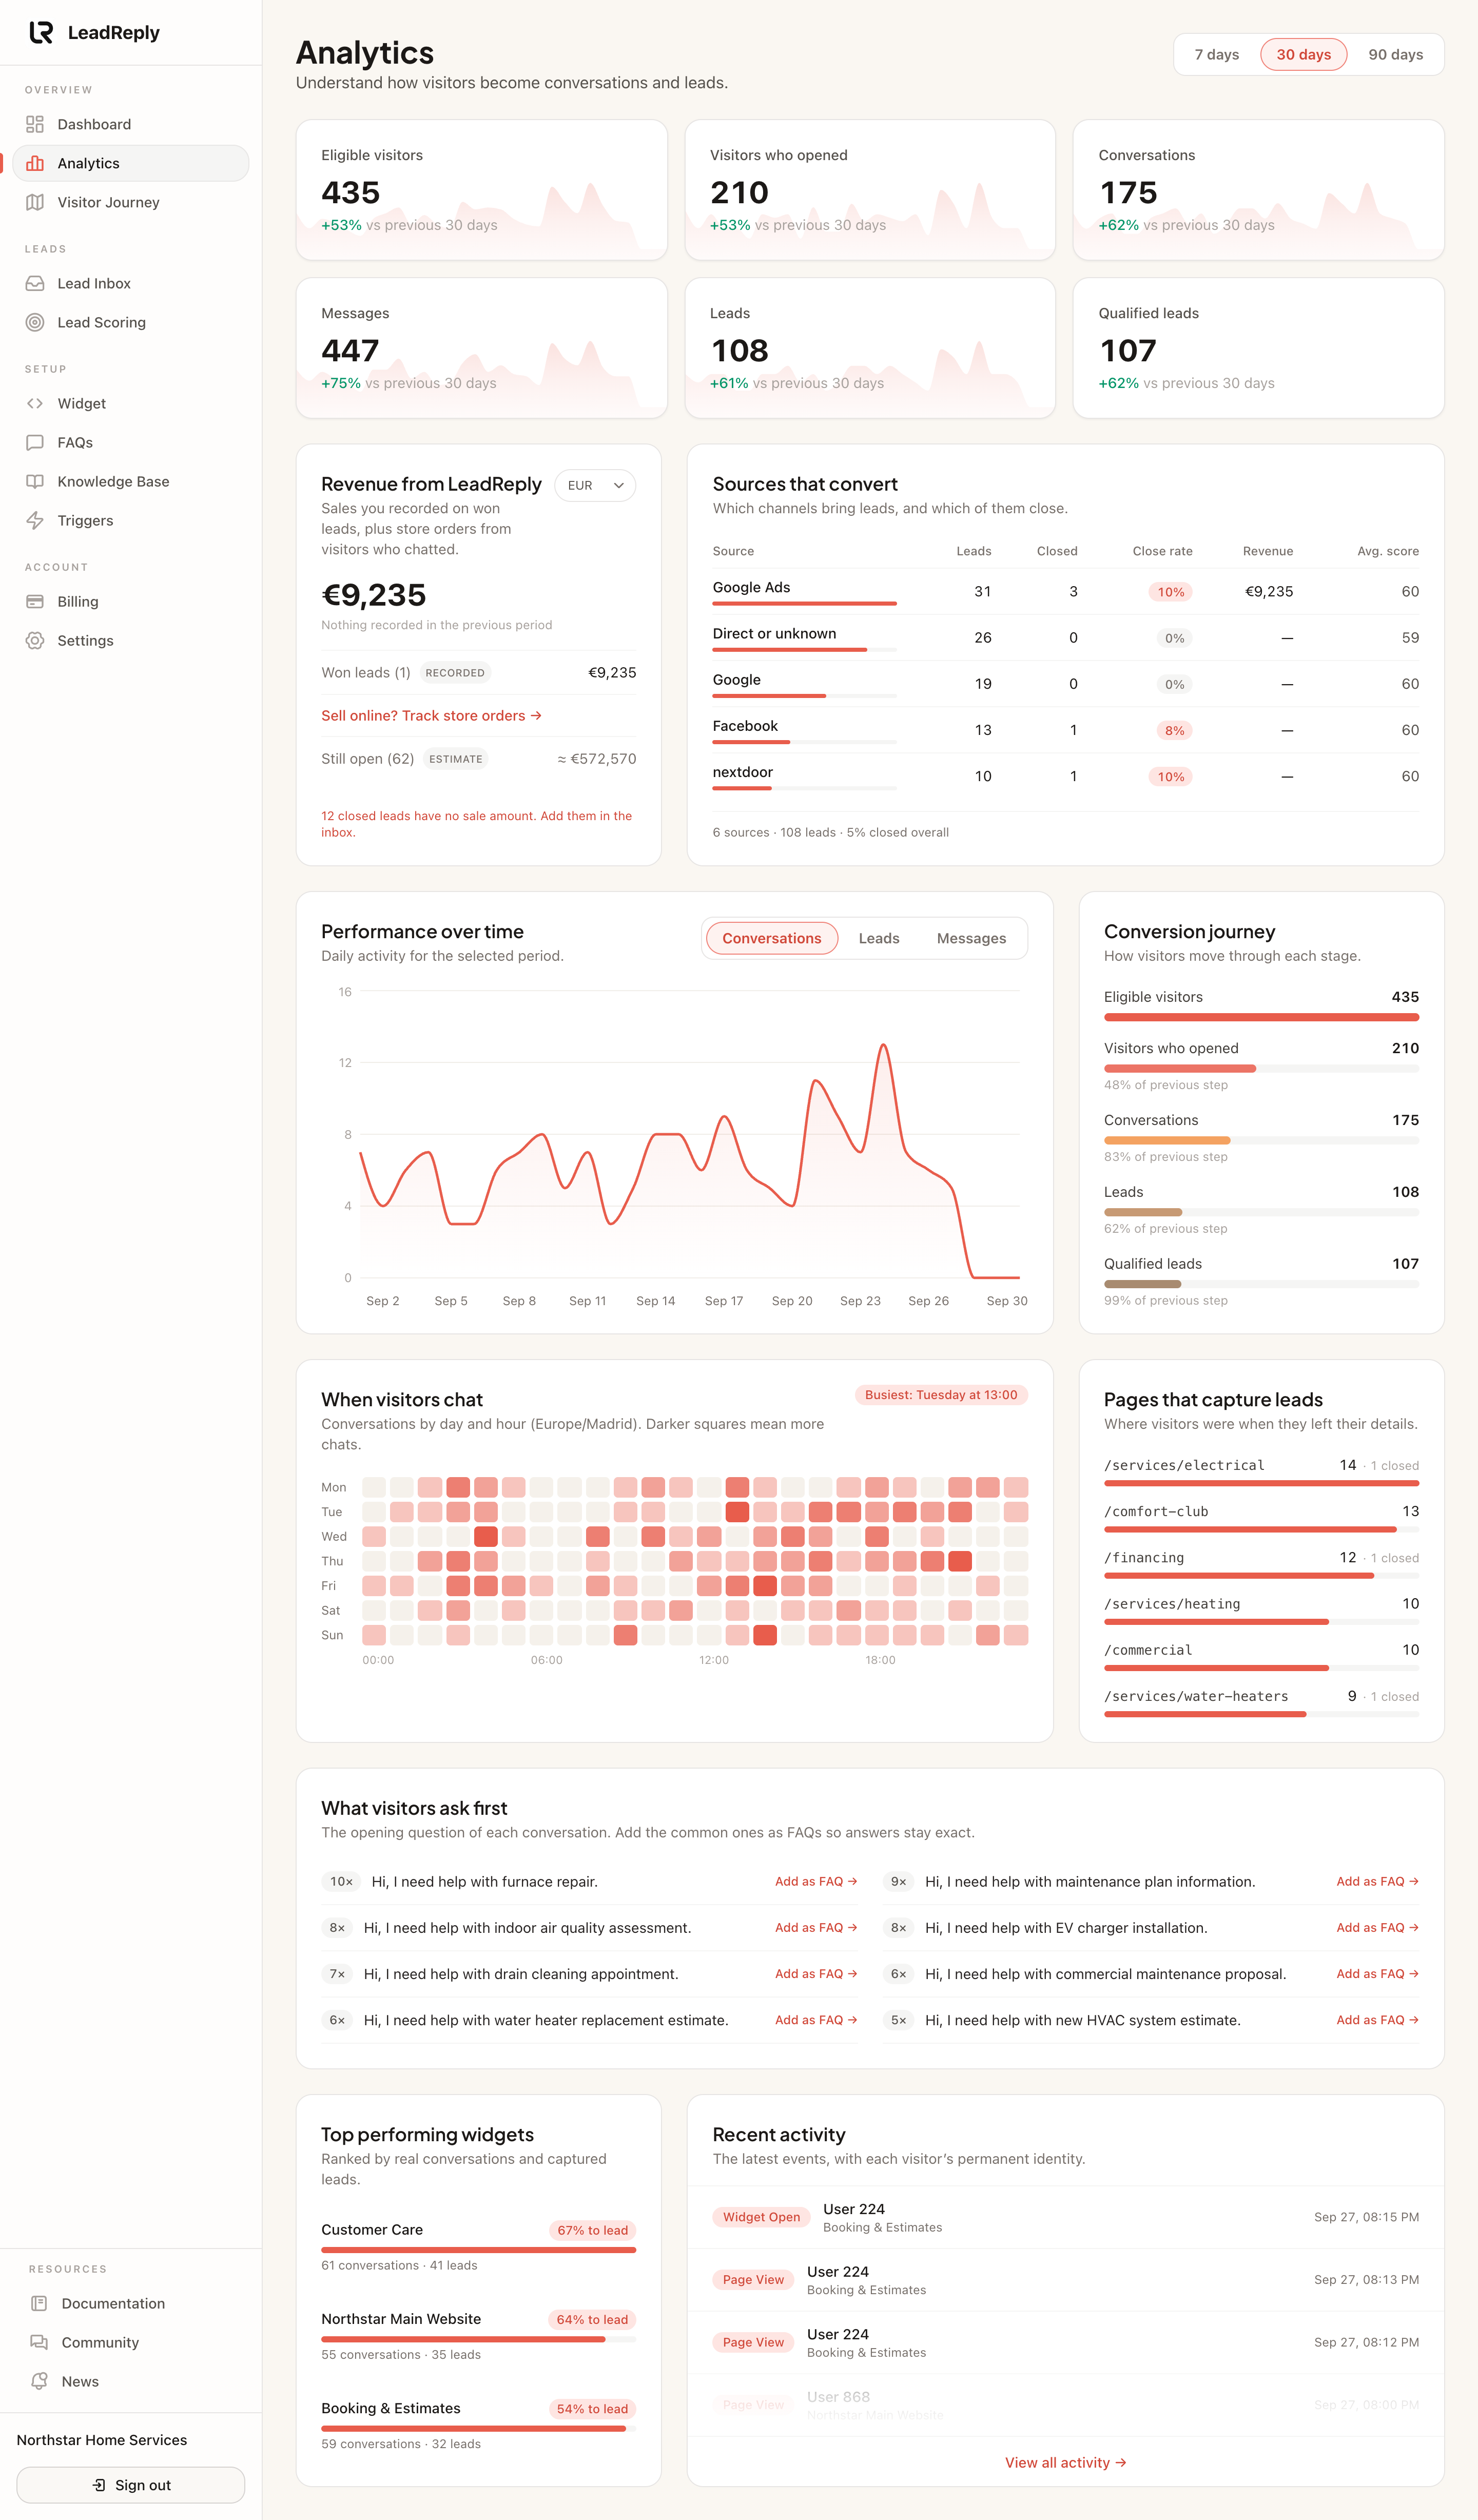
The Analytics page answers three questions: how many people came, how many engaged with the widget, and how many became leads.
The funnel
Think of the :
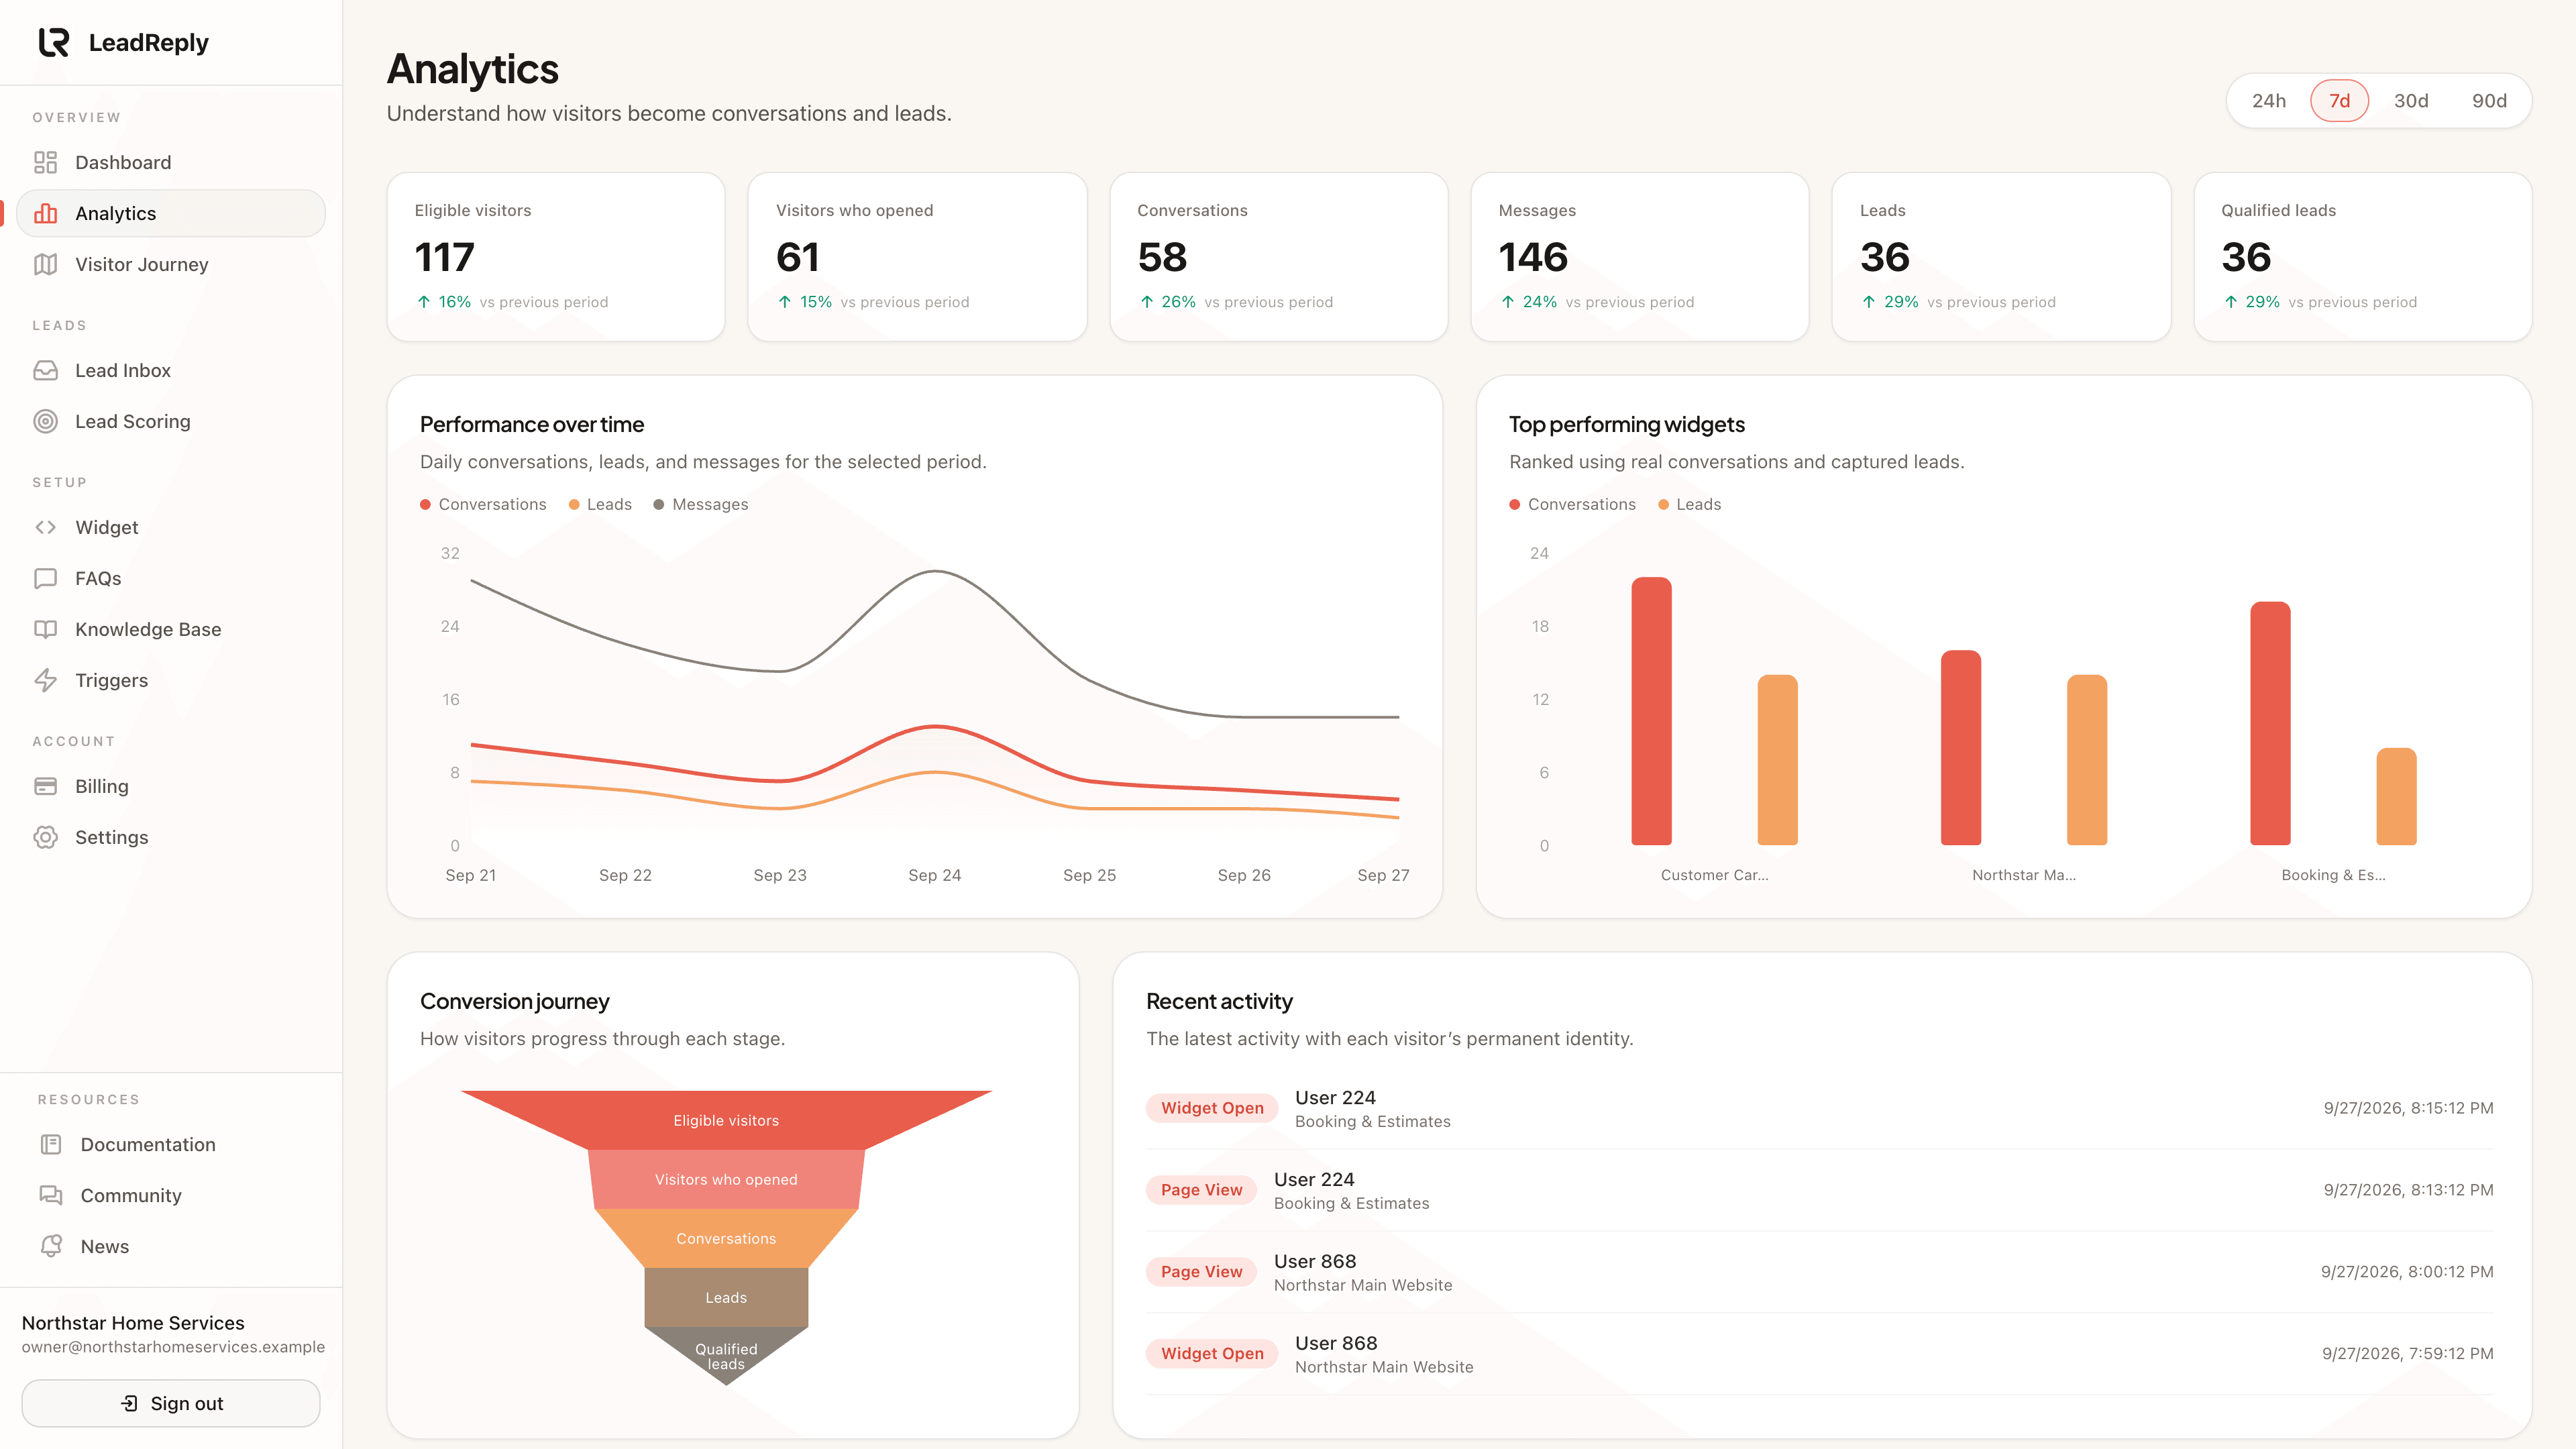
- Sessions — visits to pages where the widget is installed.
- Widget opens — visits where someone actually opened the chat.
- Messages exchanged — conversations with real back-and-forth.
- Leads captured — visitors who left contact details.
Each stage's rate tells you where to improve. Lots of sessions but few opens? Your greeting or bubble placement needs attention. Opens but few leads? Look at your FAQs and how the widget asks for contact details.
Metrics reference
- Total sessions: number of visitor sessions in the period.
- Average duration: mean time visitors spent on your site.
- Pages per session: average number of pages viewed — a proxy for interest.
- Widget open rate: share of sessions where the chat was opened (triggers can raise this — see Triggers).
- Leads captured: sessions that ended with contact details shared.
Note
Numbers update as visits happen. A session counts once per visit; one person visiting on three different days is three sessions.
Common patterns worth acting on
- Evenings/weekends spikes: that's exactly when you're not answering — the widget is doing its job. Check whether those chats produce leads.
- High traffic, low opens: try a friendlier greeting or a trigger.
- Opens but short chats: the AI may be missing good answers — add FAQs for what people ask.
Media
Previous
Lead scoring
Score leads with your own rules and auto-qualify the best
Next
Lead sources
How LeadReply knows a lead came from Instagram, Google or an ad
Questions & answers
Ask about this page — the LeadReply team and other readers can answer and upvote.
Log in to ask a question, reply, or upvote. Reading is open to everyone.
Loading discussion…